こんな疑問に答えます。
この記事の内容
- 表(テーブル)問題のパラグラフ構成
- サンプルアンサーの分析
- Task1の採点基準(試験官はどこを見ているか?)
- 表(テーブル)問題で使える便利表現
当校について
2009年にカナダ初の日本人講師陣によるIELTS専門校として創設され、12年間に渡って1,500人以上の日本人を指導。
ライティングTask1表(テーブル)問題の書き方
まず構成ですが、合計で4パラグラフに分けて書いていきます。
- イントロ(問題文の言い換え)
- テーブルの概要(全体的なまとめ)
- 詳細その1(数字で具体的に記述、比較)
- 詳細その2(数字で具体的に記述、比較)
よく、第4パラグラフとして結論(コンクルージョン)を書く方が多くいますが、アカデミックライティングのTask1に結論は必要ありません。
第1パラグラフ:イントロ(問題文の言い換え)
いわゆるイントロと呼ばれるもので、同義表現を使って問題文の言い換えをします。
また、言い換えはできる限りの範囲でかまいません。よくあるパターンとして、無理やり言い換えをしようとした結果、違和感のある文章になってしまい、問題文の意味と逸れてしまうこと。
第2パラグラフ:概要(全体的なまとめ)
第2パラグラフでは表(テーブル)の概要を述べます。
主な着眼点としては、全体的に一番高かった数字、または低かった数字などです。
第3パラグラフ:詳細その1(数字で具体的に記述、比較)
表(テーブル)には、第2パラグラフで述べた点以外にも細かい動きがたくさんあるはずです。
Task1で使いやすい表現を駆使して、細かい点を述べていきます(表現は後述)。
第4パラグラフ:詳細その2(数字で具体的に記述、比較)
多くの人が理解していない点として、『第3パラグラフと第4パラグラフをどういった基準で分けるか?』があります。
結論から言うと、これに正解はありません。それぞれ3パラと4パラにしっかりと別々の役割を持たせた上で、区切ることが大切です。
ライティングTask1表(テーブル)問題のサンプル
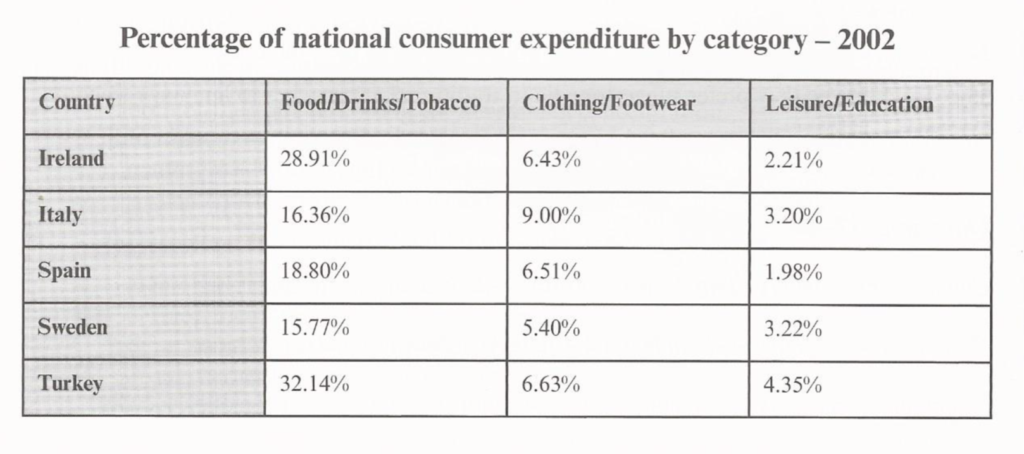
The table below gives information about consumer spending on different items in five different countries in 2002.
The table illustrates the proportion of national expenditure in Ireland, Italy, Spain, Sweden and Turkey on three types of consumer items in 2002.
Overall, the category of consumer goods that all countries spent most on was food, drinks and tabacco, which was three times higher than on the other types of goods. The lowest spending could be seen in the category of leisure and education in all five countries. The outlay of Turkey was generally higher than the other four countries.
In terms of food, drinks and tobacco, Turkey spent the most at 32.14%. The expenditure of Ireland was also high (28.91%) compared to Sweden which spent the least (15.77%). Spain and Italy spent 18.80% and 16.36% respectively. On the other hand, the lowest expenditure was on leisure and education which accounted for under 5% in all countries. Turkey spent most on these items at just 4.35% of their national expenditure which is around double that of Spain (1.98%).
Clothing and footwear was the third category of consumer goods and outlays for those items were between 9% in Italy and 5.40% in Sweden. The national spending in this area for the remaining countries averaged around 6.5%.
(196 words, band 9)
出典元:https://ieltsliz.com/
※Cambridge IELTS Writing Test1から引用
こちらのサンプルから、Task1の実践で使える表現を抽出していきましょう。
第1パラグラフの表現
- illustrate
=説明する、例示している - proportion
=割合
第2パラグラフの表現
- Overall
=概して、全体的に - three times higher than A
=Aより3倍大きかった - A could be seen
=Aが見られた(データとして) - outlay
=資金
第3パラグラフ(ボディ1)の表現
- In terms of A
=Aの点においては - the most
=一番 - compared to A
=Aと比べて - respectively
=それぞれ - On the other hand
=一方 - account for A
=Aを占める - double
=2倍(今回はthatにかかっている形容詞として使用)
第4パラグラフ(ボディ2)の表現
- between A and B
=AとBの間 - average
=平均する(今回は動詞として使用)
アカデミックライティングTask1の採点基準
- Task Achievement:タスクに対する回答が書かれているか、概要の有無、データの詳細
- Coherence & Cohesion:段落、リンキングフレーズ
- Vocabulary:連語、スペルとその正確さ
- Grammar:文の構造、時制、句読点、幅広い文法とその正確さ
試験官はこの4つの採点基準に沿って、受験者のエッセーにスコアをつけます。
どれだけ素晴らしいエッセーが書けていても、この4つの採点基準に沿ってエッセーを書かない限り、必要スコアを取ることはできません。
こちらの記事では、さらに細かく採点基準を解説しています。
あいこ IELTSのスコアって具体的にどうやって計算されるの? こんな疑問に答えます。 この記事の内容 IELTSスコア採点方法 リスニング、リーディングのスコア基準 ライティングとスピー[…]
ライティングTask1の表(テーブル)問題の便利表現
上がる(一般的に)
increase / rise / go up / climb / show an upward trend / grow
上がる(急に)
jump / soar / rocket / leap
超える
exceed / surpass / outperform / outdo
最高値になる
peak / reach a peak
一旦下がったものがまた上がる
recover
〜倍
double / triple / quadruple
下がる系
decrease / drop / go down / decline / shrink
下がる(急に)
dip / slump / plunge / plummet
最低値になる
bottom out / reach a bottom
半分になる
halve
変化がない、安定している
level out(off) / plateau / remain stable(steady/the same/consistent/flat) / see(experience) no(little) change
まとめ
今回はIELTSライティングTask1の表(テーブル)問題の解説を行いました。
- パラグラフ構成
- 採点基準
- Task1でよく使う表現のインプット
この3点をしっかりと行っておきましょう。


